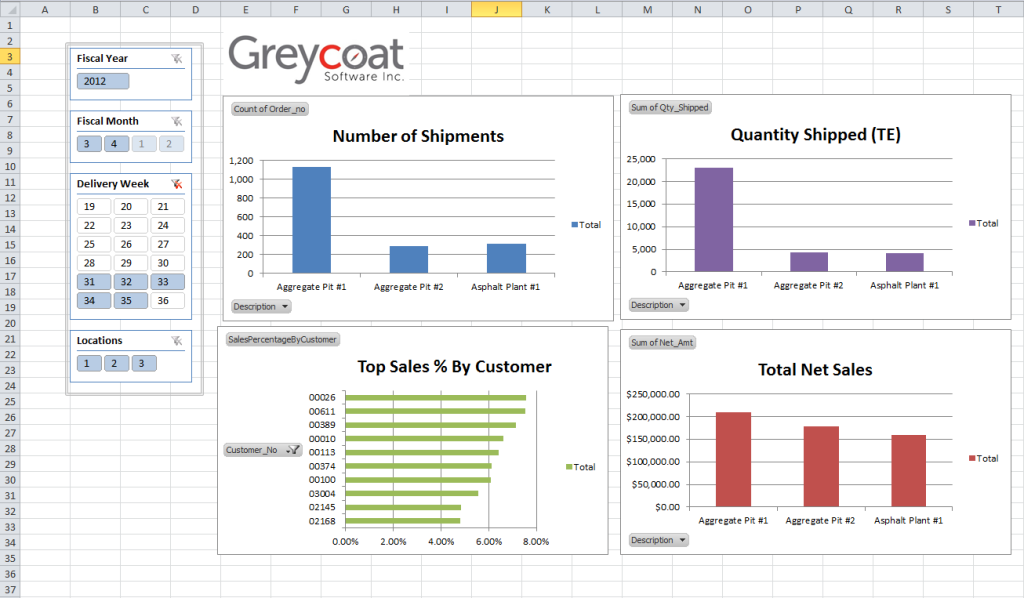
Compass Dashboard is a strategic and operational real-time reporting system, incorporating the latest advances in data mining and presentation technology.
Compass Dashboard:
enables tighter control and oversight for operations managers by displaying to-the-minute delivery and production information,
facilitates advanced financial planning and budgeting through its drill down and filtering capabilities,
utilizes business intelligence presentation technology from Microsoft and map based programs from Google (with Compass GEO) to interpret results quickly, and
provides for a nightly mail-out to managers of key process indicators, up to date to the end of that day’s business.
Click on image to enlarge.
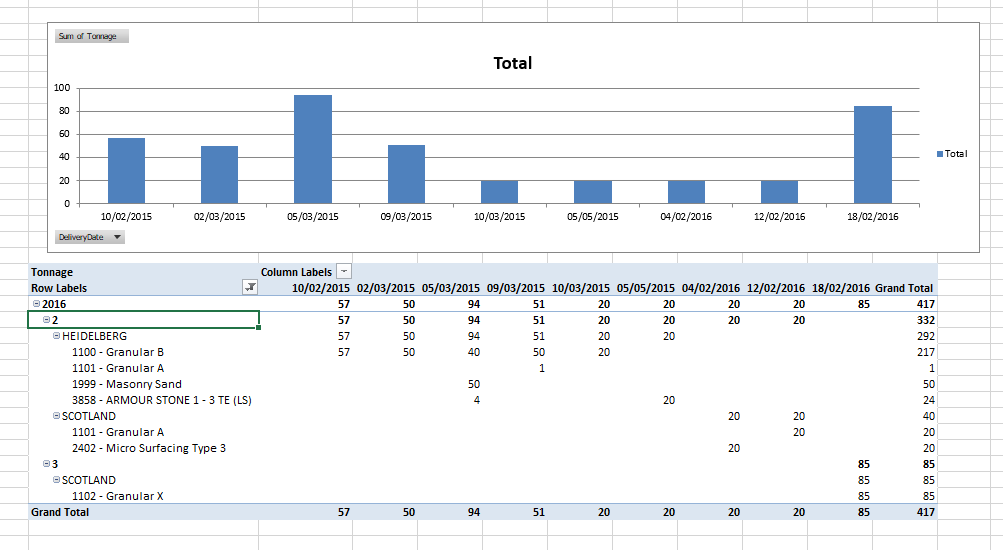
Job Delivery progress by day.
In addition to providing key parameter mailouts (by email or through Microsoft Power BI), the Compass Dashboard provides detailed, deep analyses, such as this one showing job delivery progress.
Click image to enlarge.
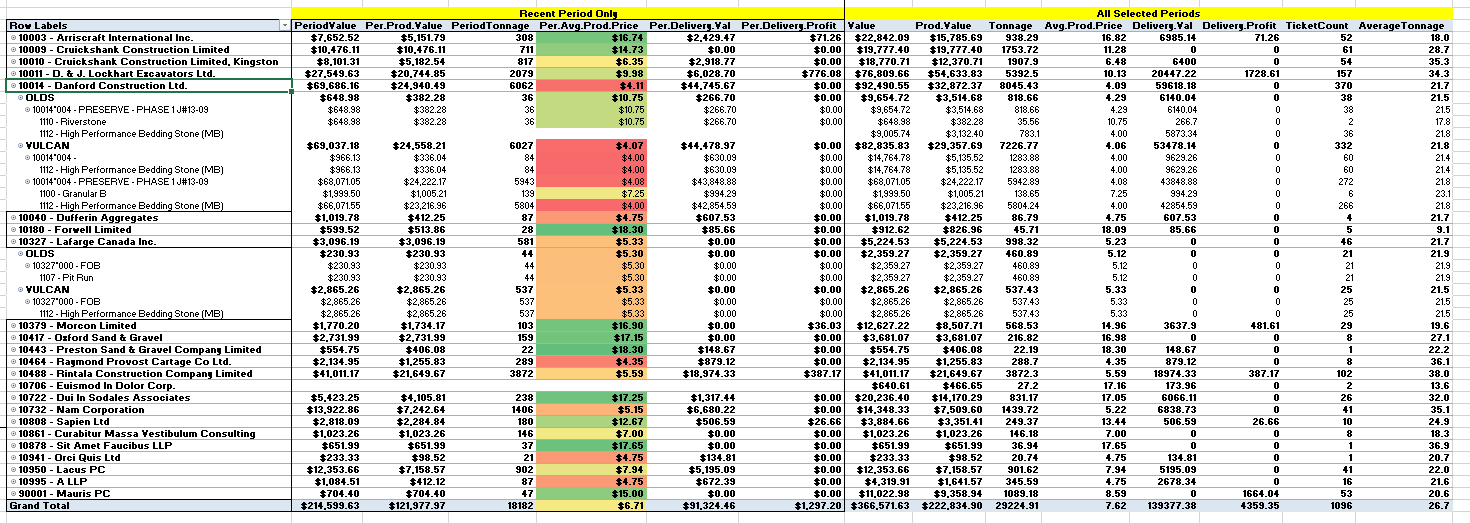
Customer Price analysis.
This is a section of the material price analysis by customer. Material and delivery prices achieved are shown in separate columns. Customers can be expanded to show detail by delivery location, job and product.
There are 12 varied and detailed analyses available within the Dashboard module.
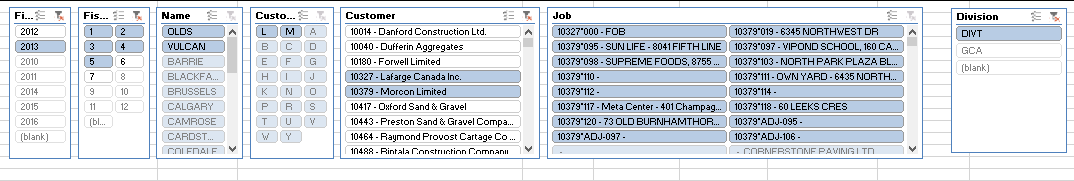
Slicers.
Slicers allow an interactive drill down into the data to select on the basis of time periods, customers, jobs, product groups, individual products and other elements.
Each of the 12 Dashboard analyses has its own set of appropriate slicers.
Click on image to enlarge.
The above shows a range of customer related slicers. Slicers are activated with a mouse click, and standard Windows multi-select features can be used (control-click, and shift-click).
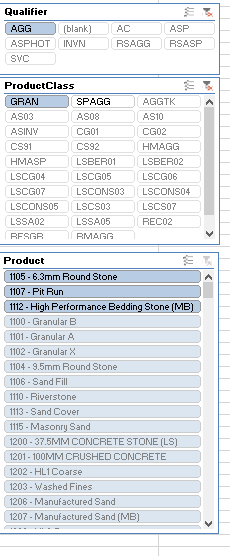
Click on image to enlarge.
The above shows the range of product related slicers that may apply.
Compass Dashboard requires Microsoft Excel PowerPivot and for some optional features, Microsoft Power BI.